Skip to content
Starlyzer

Features

Everything for data analysis in one program

From a first look at your data to control charts, process capability analysis and design of experiments. Every command uses the same worksheet and the same results log.

The program comes in a Standard and a Professional edition. The Professional label on a feature means it is available only in the Professional edition. Edition comparison and pricing

Statistics and hypothesis tests

Descriptive statistics, hypothesis tests and models, with results in a permanent log. Assistants help you choose the right test.
  • Descriptive statistics, graphical summary and correlations
  • t-tests and tests of standard deviations, proportions and Poisson rates
  • One-way ANOVA with main effects and interaction plots
  • Balanced ANOVAProfessional
  • Nonparametric tests and an assistant for choosing oneProfessional
  • Linear regression with one variable (Fitted Line Plot)
  • Regression with model selection, prediction and logistic regressionProfessional
  • Power and sample size
  • Power for factorial designsProfessional
  • Chi-square tests, distribution identification, Box-Cox and Johnson transformations
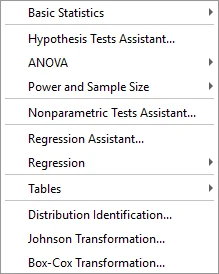
The Stat menu in Starlyzer

Graphical analysis

Graphs are part of the results log, so you see them next to your data. Copy one to Word or PowerPoint in a single click, in high resolution.
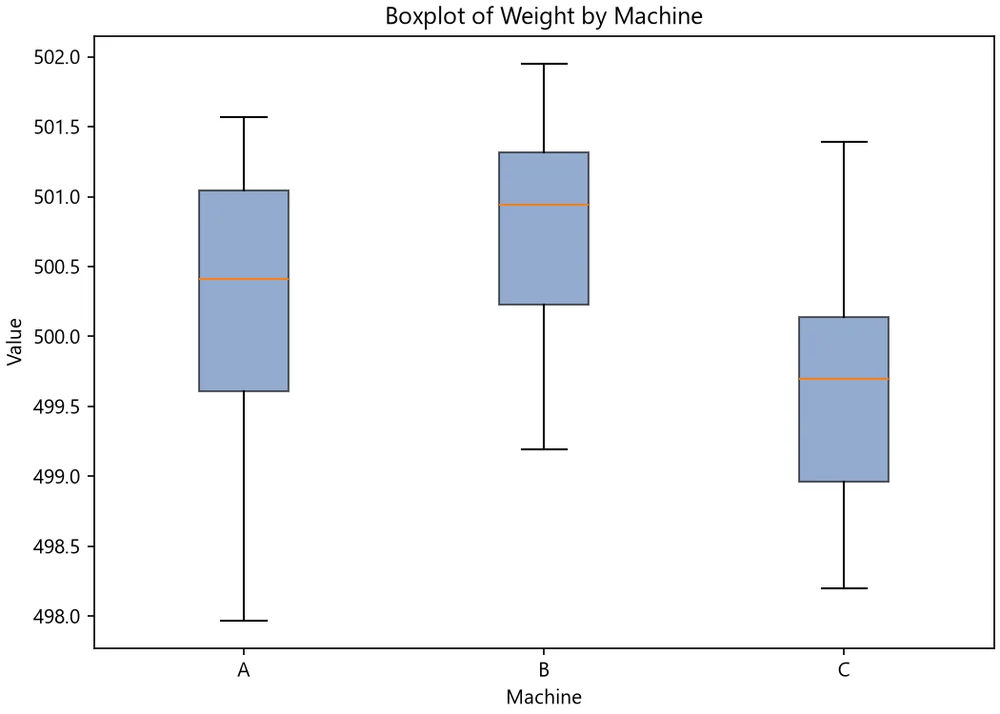
  • Histogram, boxplot and scatterplot with a regression line
  • Pareto, pie and bar charts
  • Time series, probability plots and matrix plot
  • Multi-vari chart and Ishikawa diagram
  • Graph Builder for composing your own graphs
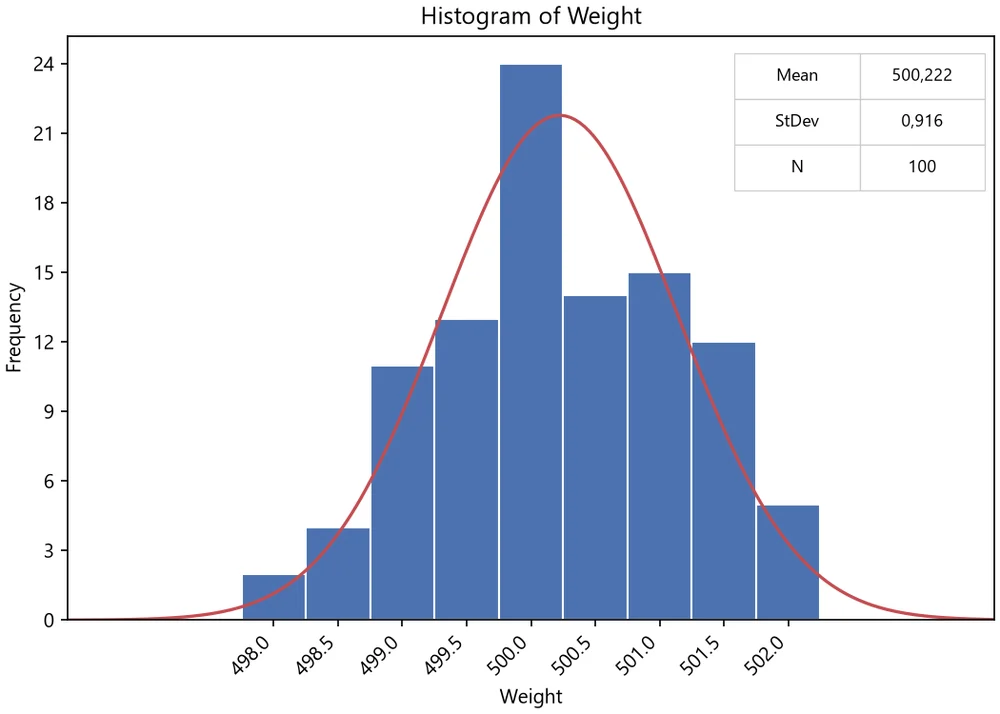
Histogram of fill weight
Boxplot by machine
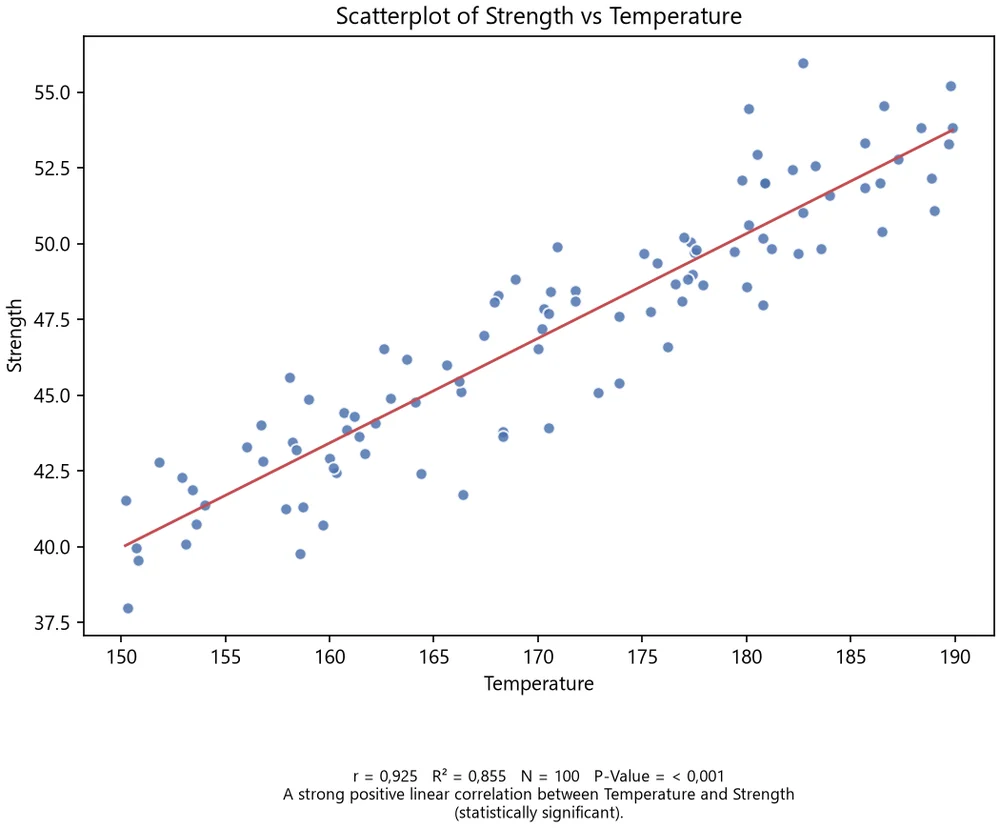
Scatterplot with a regression line
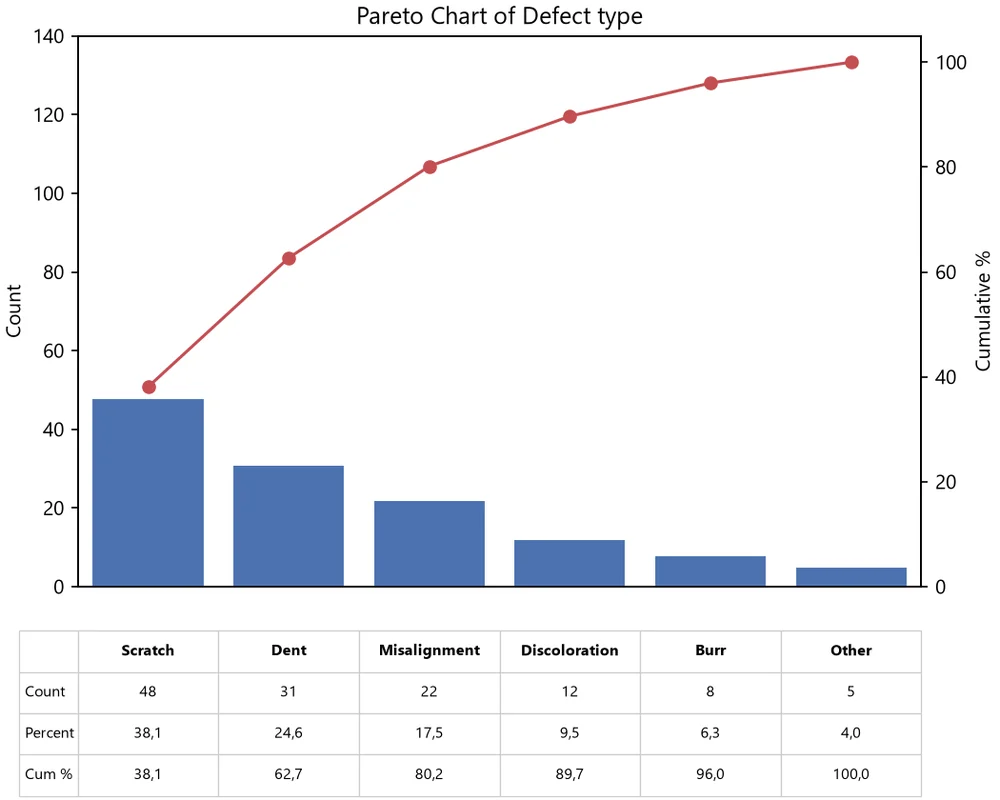
Pareto chart of defects

Control charts

A selection diagram guides you to the right chart for your type of data. The report contains a summary, a stability report and a Report Card.
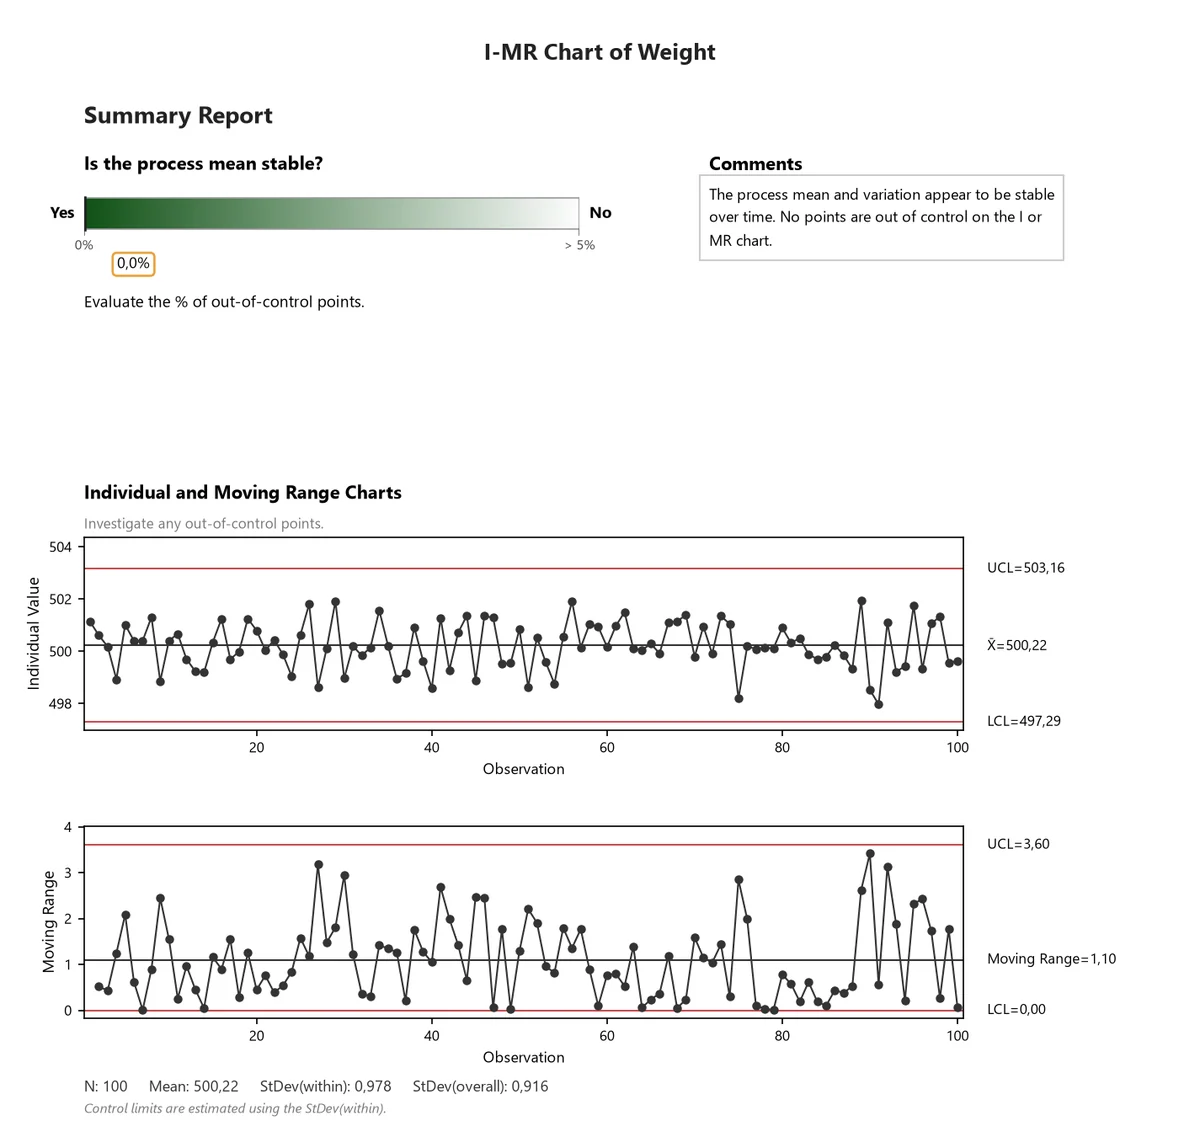
  • I-MR, Xbar-R and Xbar-S
  • Attribute charts p, np, c and u
  • Before/after charts for a process change
  • Advanced charts: I-MR-R/S, moving average, EWMA and CUSUMProfessional
  • Acceptance control charts per AIAG-VDA SPC (2026)Professional
  • Points marked by tests for special causes, with explanations
An I-MR control chart with the stability report

Process capability

The report answers whether the process is capable: indices, a histogram with the limits, diagnostics and a Report Card that checks the assumptions.
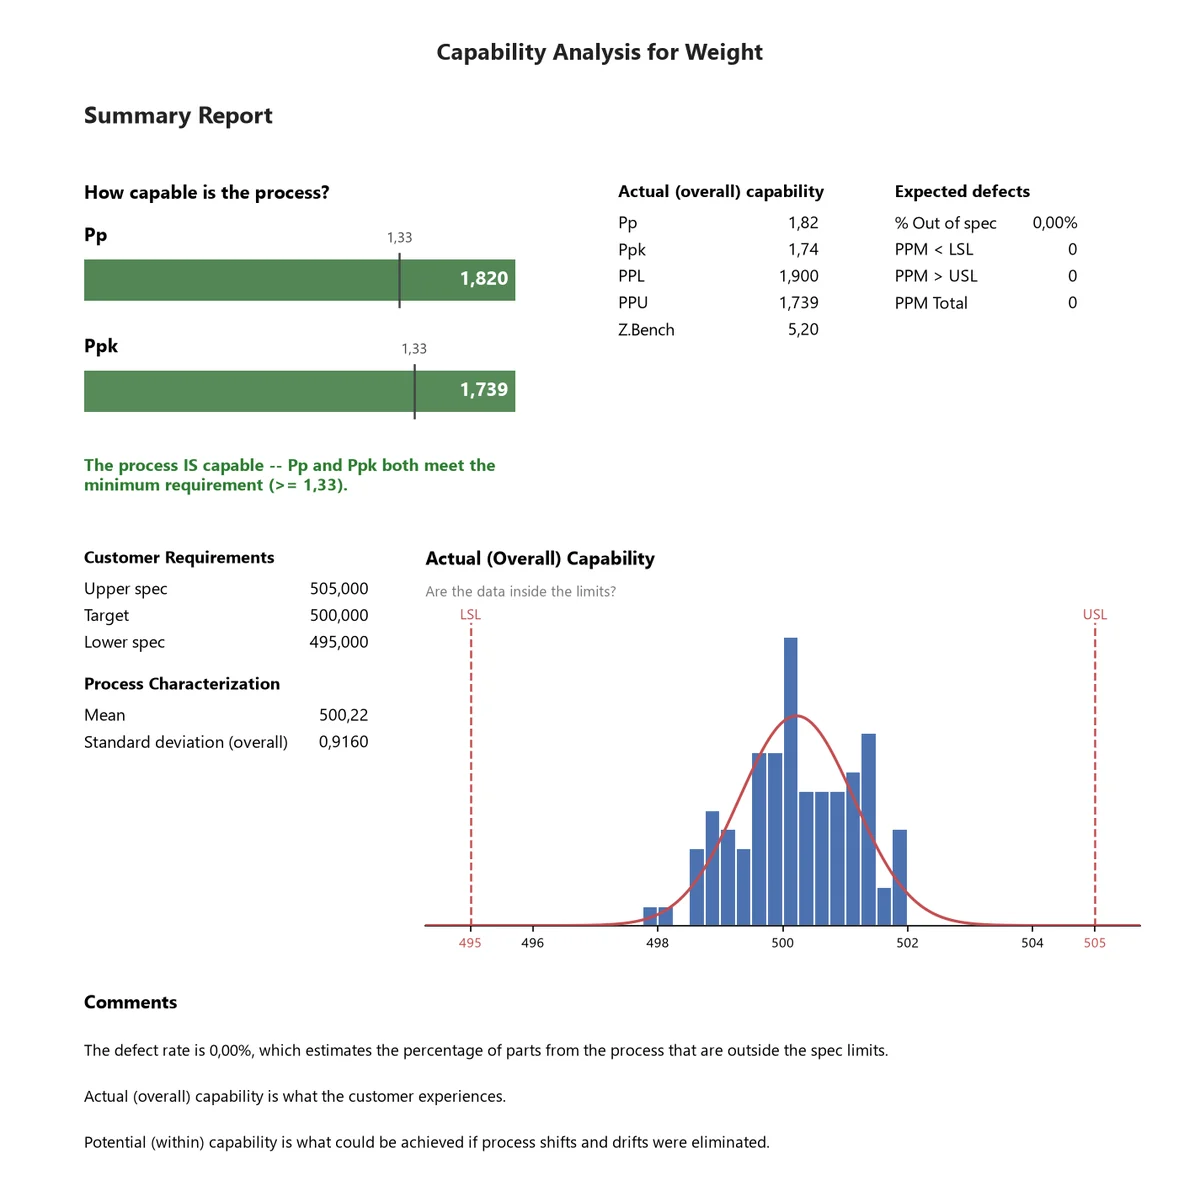
  • Normal and non-normal distributions
  • Binomial and Poisson data
  • Before and after comparison
  • Capability simulator for trying out scenarios
  • A plain-language conclusion and checks of stability, normality and amount of data
Summary of a process capability report
New

Process capability per AIAG-VDA SPC (2026)

You can calculate capability analysis according to the AIAG-VDA SPC (2026) manual. The choice is in the Capability Analysis commands for normal and non-normal distributions. Available in both the Standard and Professional editions.
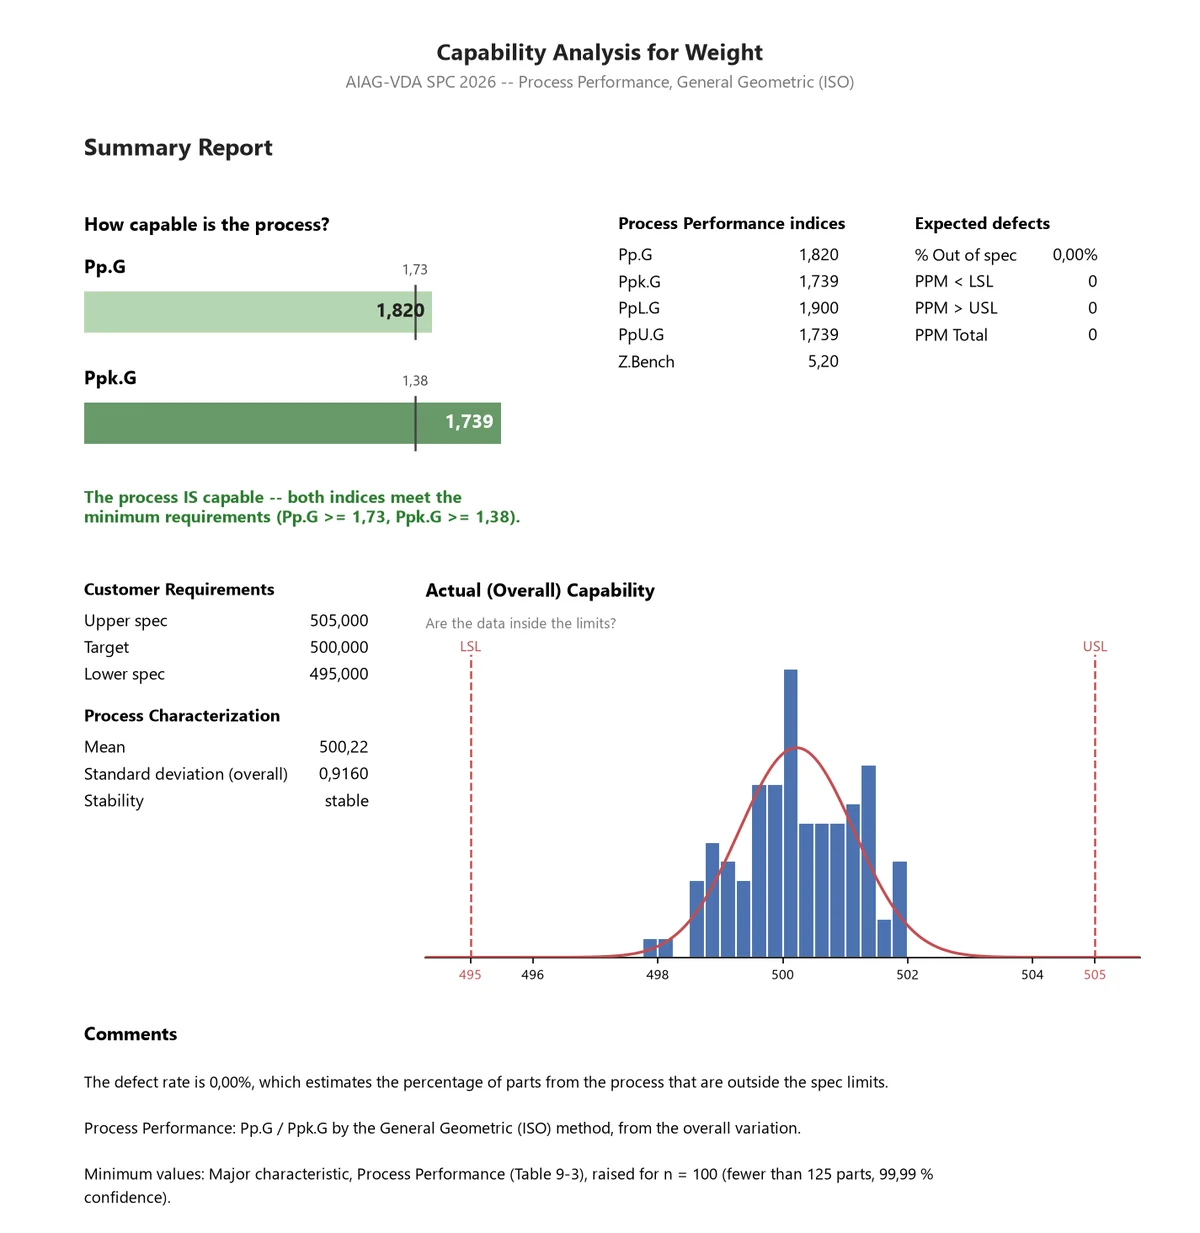
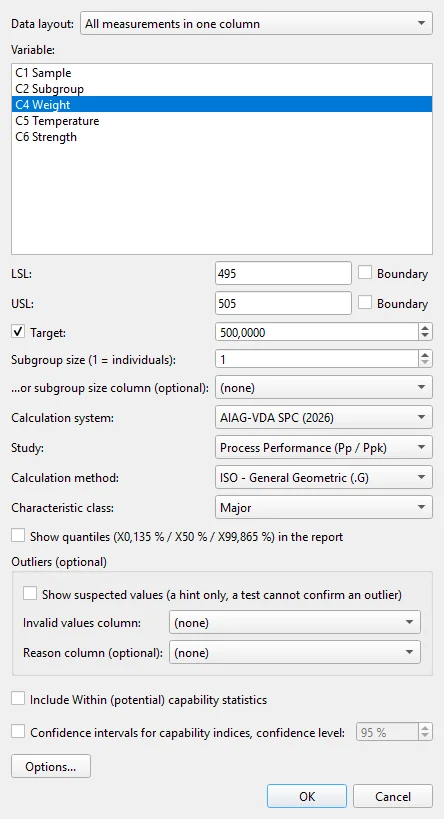
  • Pp/Ppk, Cp/Cpk and Pm/Pmk studies
  • ISO (.G) and z-score (.Z) methods
  • Characteristic classes (Critical, Major, Minor, Others) with the recommended limits of the manual
  • Outliers are marked with a documented reason and are never deleted
A process capability report in the AIAG-VDA SPC (2026) mode
The Capability Analysis dialog with AIAG-VDA SPC (2026) selected

Calculations follow the AIAG-VDA SPC manual. AIAG and VDA are the names of the respective organisations. Starlyzer is not affiliated with them and is not endorsed or certified by them.

Worksheet and workflow

The worksheet, results and graphs share one window, so you never switch between tools while working.

A spreadsheet-style worksheet

Editing, auto-fill, sorting and column formatting.

Data preparation

Stack and unstack columns, subsets, merging and splitting worksheets, a calculator and random data.

Opening and saving

CSV and Excel files, and the program's own file format.

Results log

Results and graphs stay in the log. Repeat the last dialog with Ctrl+E.

And more

For more demanding tasks

Measurement systems analysis

Gage R&R, type 1 study and attribute agreement analysis.

Design of experiments (DOE)Professional

Factorial and response surface designs with analysis, prediction, contour and surface plots and a response optimizer.

Assistants

Assistants for choosing a test, a control chart, a capability analysis and a measurement system lead you from question to command. The Professional edition adds assistants for nonparametric tests, regression and design of experiments.

Try Starlyzer on your own data

Download the demo or ask us for a quote.