From data to answer
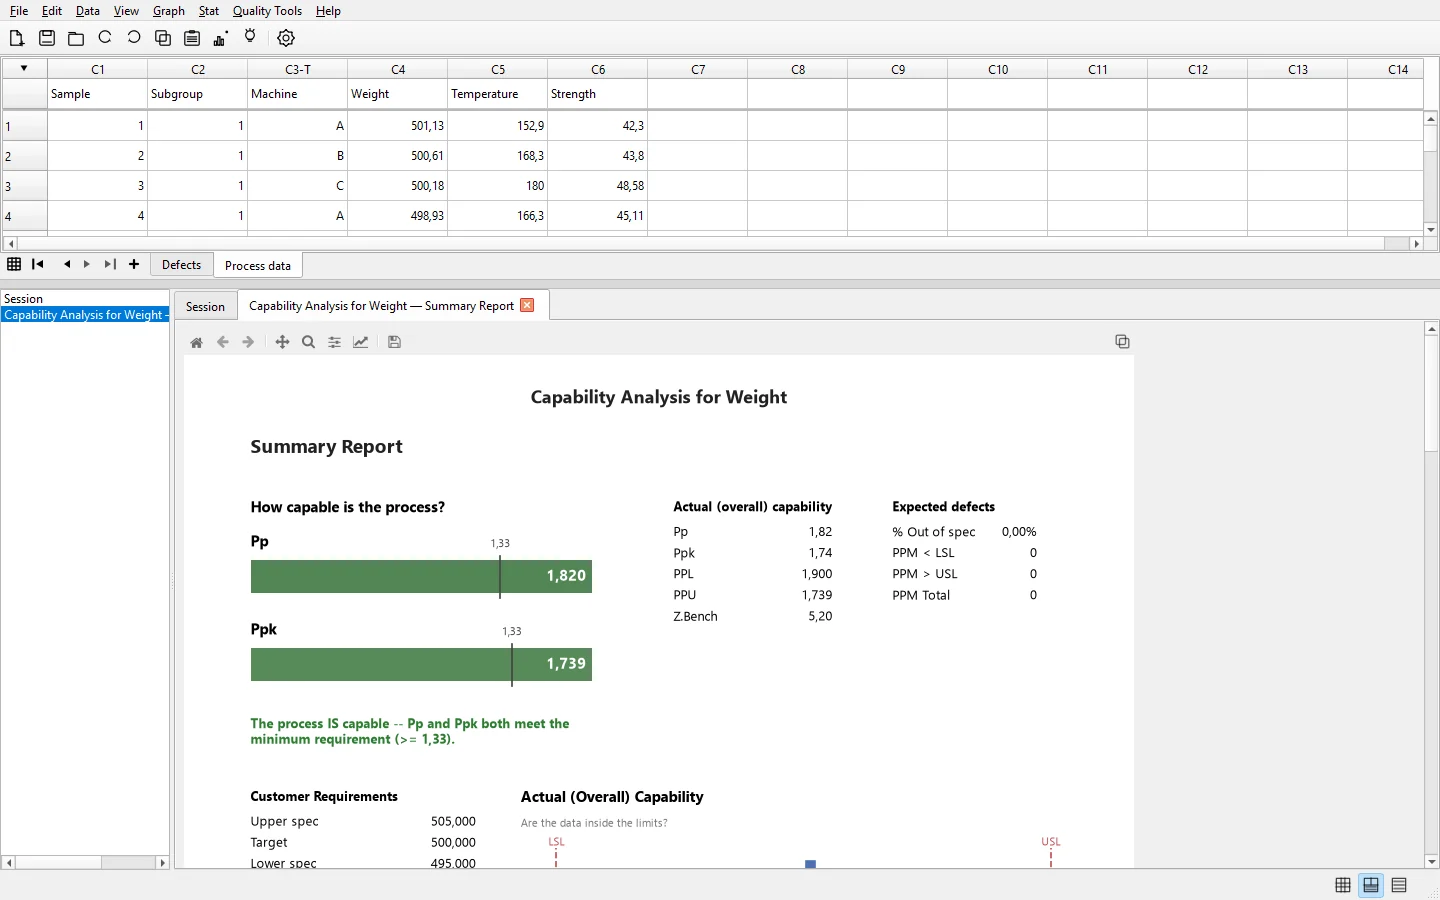
The worksheet, results and graphs share one window, so you finish the analysis without switching between tools.
Windows software
Starlyzer is a desktop program for fast, reliable data analysis: from descriptive statistics and hypothesis tests to control charts and process capability analysis.
15 days free. No registration.
Why Starlyzer
The worksheet, results and graphs share one window, so you finish the analysis without switching between tools.
We regularly compare results with established statistical tools, including demanding procedures such as the Box-Cox and Johnson transformations.
Copy a graph to Word or PowerPoint in one click, in high resolution.
The Standard and Professional editions with an annual subscription, one licence per computer. You activate the licence with a key directly in the program.
Features
Descriptive statistics, t-tests, analysis of variance (ANOVA), normality tests and confidence intervals.
Histogram, boxplot, scatterplot, Pareto, time series and other graphs, embedded in the results log.
Charts for monitoring process stability over time.
Capability analysis for normal, non-normal, binomial and Poisson data, with a full report. The normal and non-normal analyses also support the AIAG-VDA SPC (2026) calculation, relevant for the automotive industry.
Assess measurement quality and compare sources of variation.
A spreadsheet-style worksheet, column stacking, data transformations and distribution identification.
Who it is for
Process control, process capability and measurement analysis.
Statistical analysis for researchers, students and course participants.
Quickly test hypotheses and visualise measured data.
Reliable analysis without expensive infrastructure, on your own computer.
Getting started
Install Starlyzer and try it for 15 days without registering.
Register your e-mail address to receive a key for a 30-day demo.
Send an order, receive a proforma invoice, and after payment the invoice and your activation key.
Download the demo or ask us for a quote.